- by New Deal democrat
Recently I had a pretty good and spirited discussion about macroeconomics and forecasting the Great Recession.
One issue is, how easy or not was it to spot the housing bubble? Dean Baker certainly did. But was there objective evidence? There was.
Home prices themselves are not part of the CPI, although "owners equivalent rent," the housing portion of CPI, constitutes over 1/3 of that index. Ideally the inflation rate for each should stay relatively close, since rent is presumably the trade-off for housing. But in a bubble, that trade-off ends because "Everybody knows house prices only go UP!!!"
At that point, the tradeoff vanished. Rent inflation was subdued because renters wanted to become homeowners. And look what happened to the cost of housing (via the Case Shiller 10 city index) vs. owner's equivalent rent (in the linked graph, both are normed to 100 in 1987):
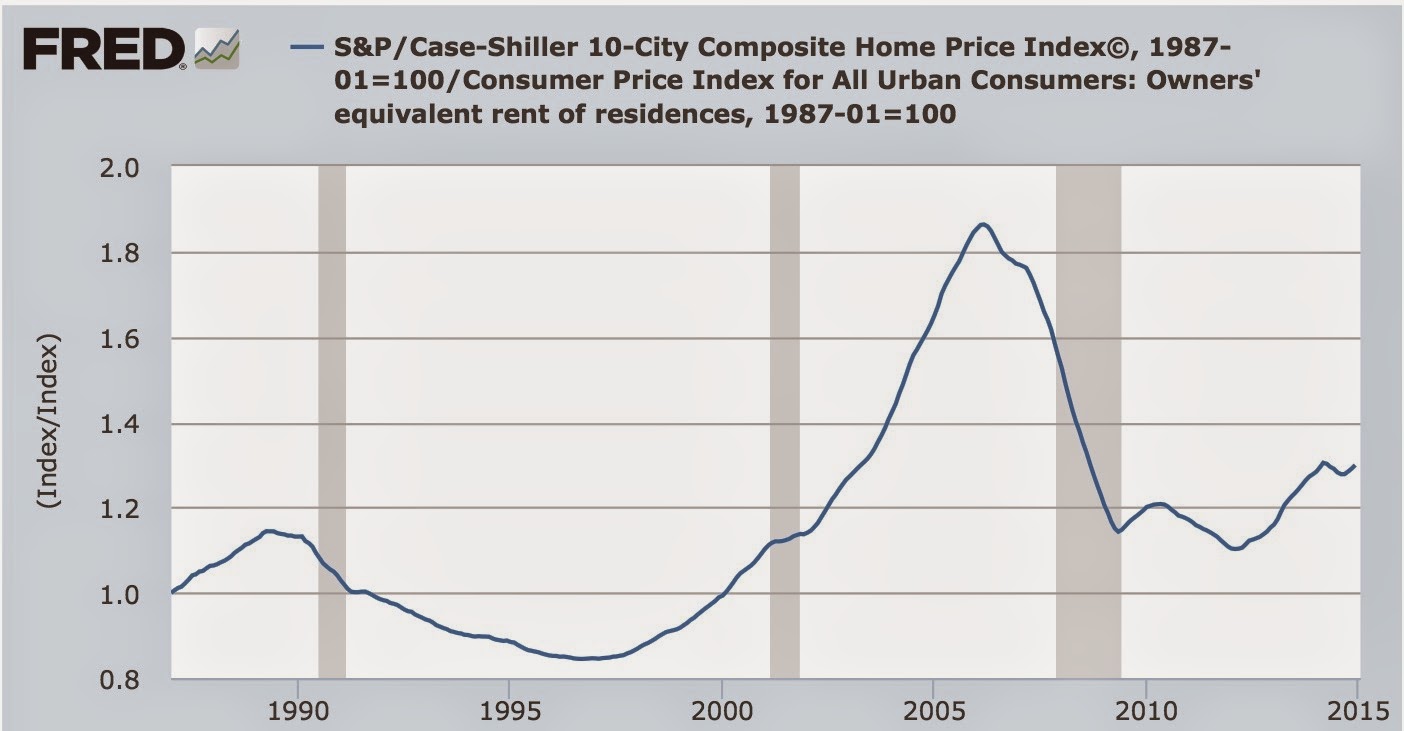
House prices went from about 1.15x the rent index to 1.85x the rent index, a 50%+ increase, in just 4 years. That is the signature of a bubble.
House prices went from about 1.15x the rent index to 1.85x the rent index, a 50%+ increase, in just 4 years. That is the signature of a bubble.
What did the Fed do in the face of that objective evidence of a bubble? Nothing, until it was far too late. Tim Iacono of "The Mess That Greenspan Made" came up with a great way of looking at housing inflation, by substituting the Case Shiller Index for the Owners' Equivalent Rent in the CPI, calling the result the CS-CPI. The below graph shows the CS-CPI in blue, and the Fed Funds rate in red:

The Fed treated inflation as subdued, and kept the Fed funds rate at 1%,when measured by the CS-CPI it was as high as nearly 10%. (I have always suspected Greenspan held off for political reasons, to assist the re-election of W. But Greenspan would never be political, would he?) Not only that, but the Fed subsequently kept the funds rate at 5% after the bubble had completely burst.
The run-up in house prices vs. rents in 2012-14, by contrast, is pretty subdued.
An interesting by-product of this is that the Case-Shiller house price index appears to lead owners equivalent rent by about 1 year:

There has been a big downturn in the growth of the Case Shiller index in the last year, that doesn't appear to have fed through into owners' equivalent rent. Nor has the recent big downturn in gas prices fed through into the direction of core CPI, which typically also takes about a year. Together, these two trends strongly suggest that core CPI inflation, already below 2%, is going to decrease further. Which by the way means that the Fed ought to hold off on rate increases, and let (hopefully) higher wage growth and lower unemployment continue.